One figure, linked biological replicates
After making a representative figure, link the remaining repeats for quantification, summaries and source-data export.
Practice with built-in examples without signing in. Register for free figure tools and an eligible full-feature trial of up to one month, subject to account and device history. After online verification, use your authorized features offline on this computer for 30 days.
From preparation to a clear result
Link repeats to one figure
Keep the representative figure and review targets, references and sample lanes within each repeat.
Inspect samples and statistics
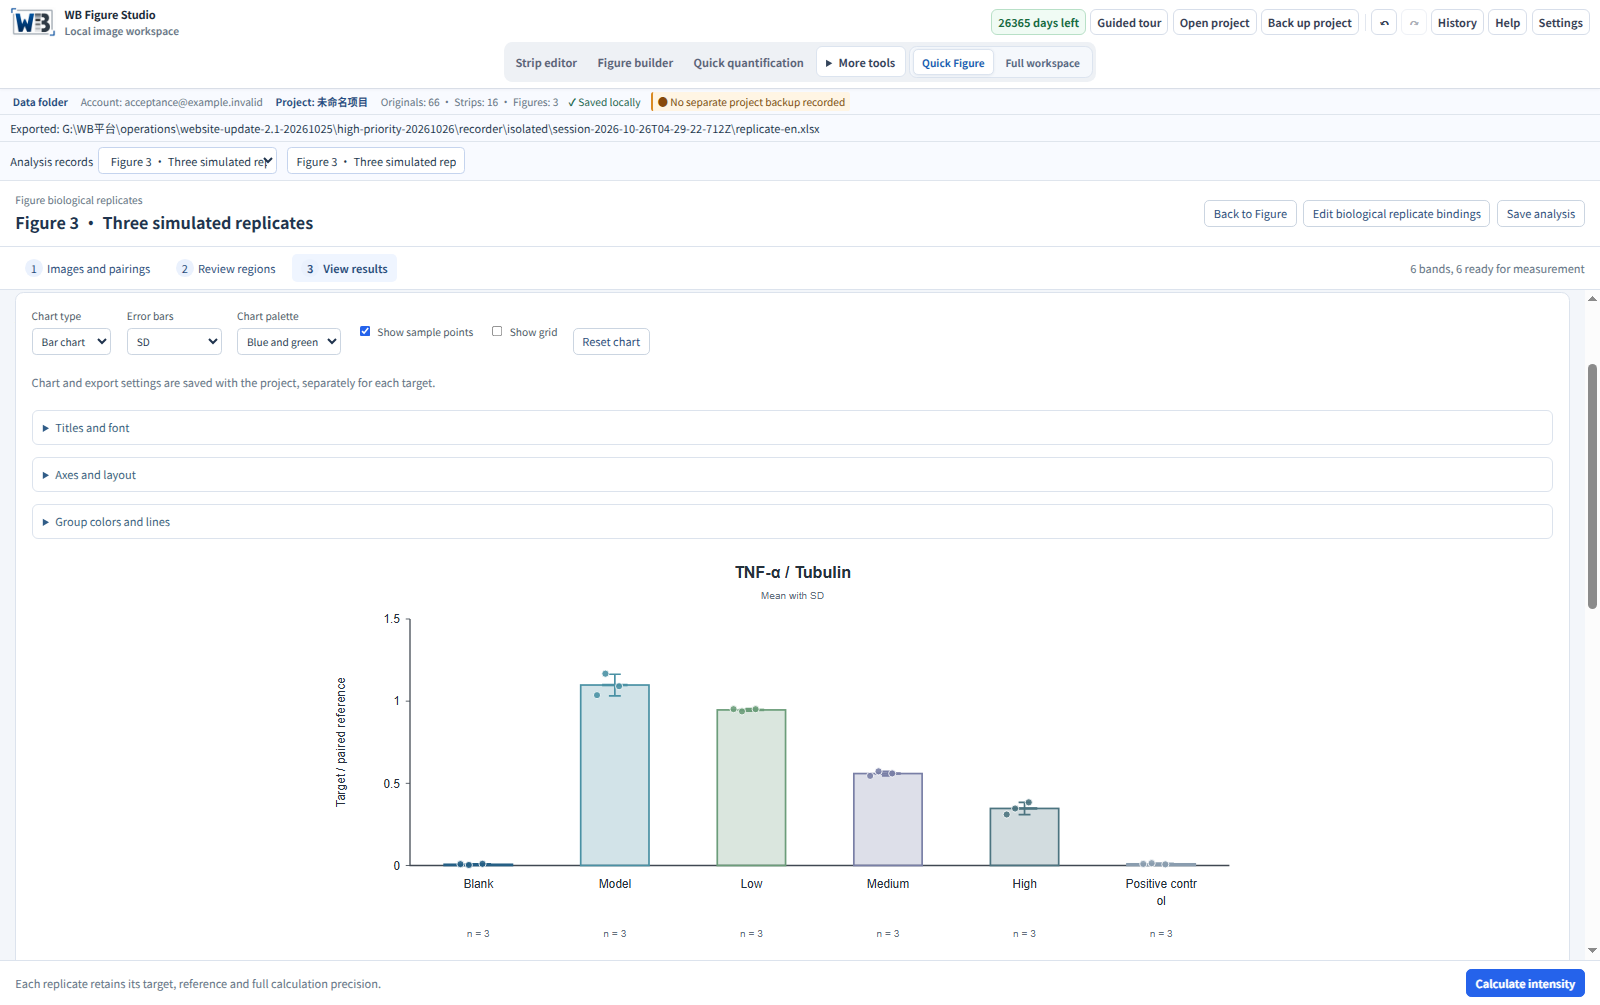
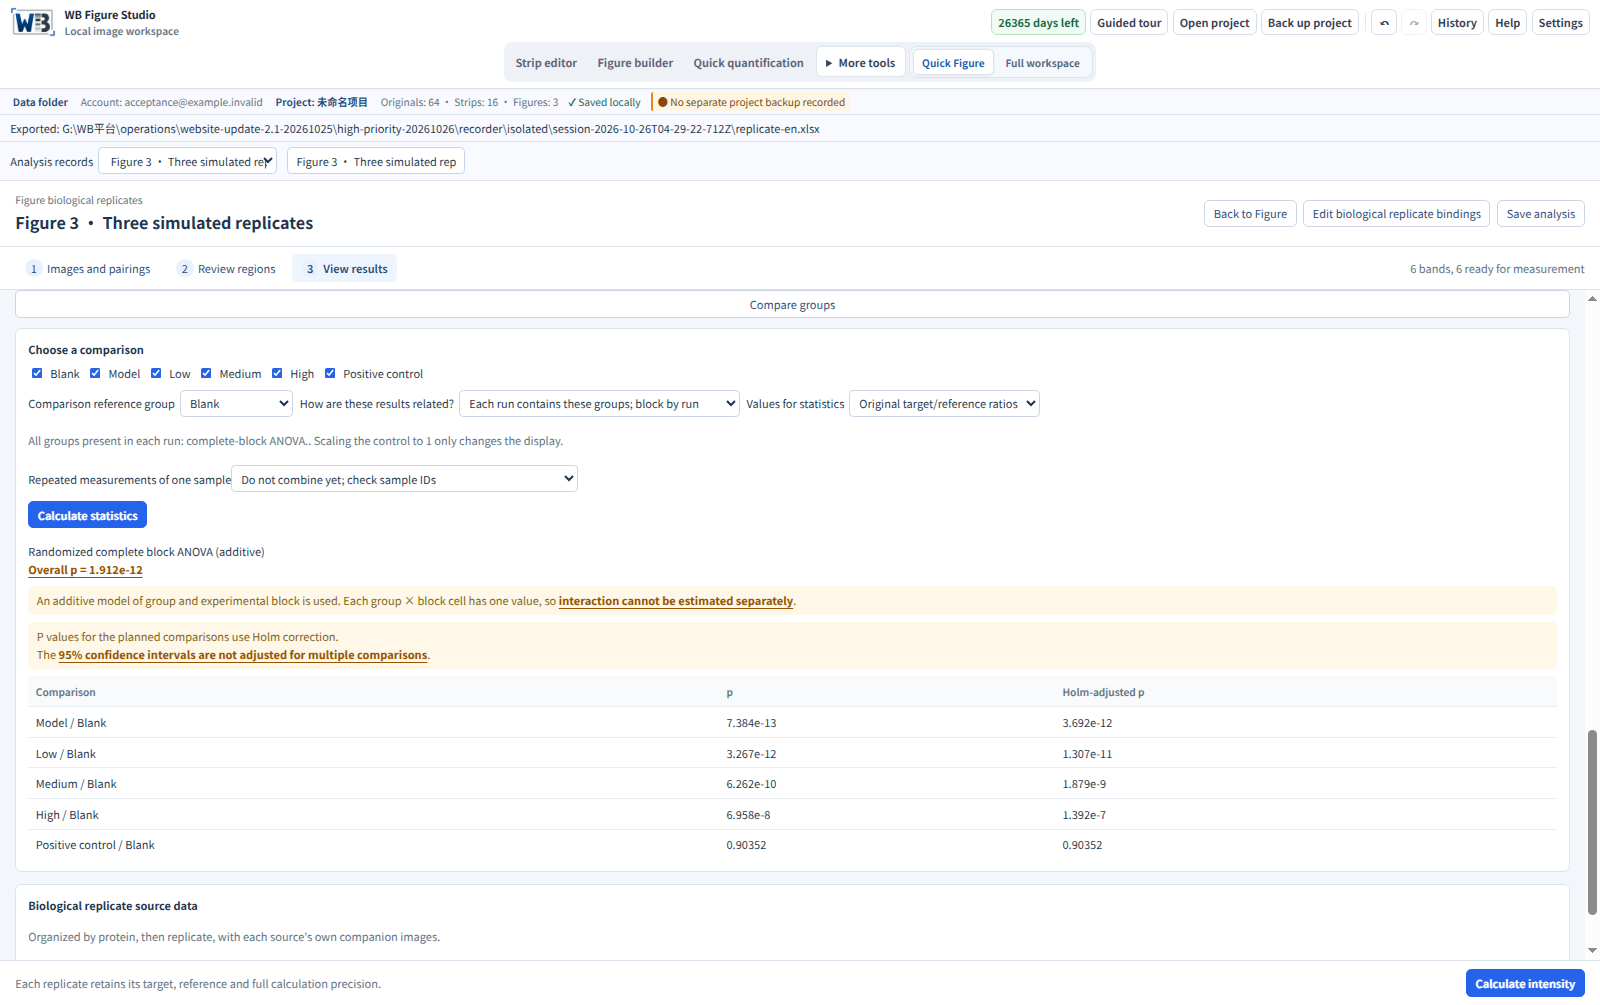
View independent sample points, means and SD. Choose the actual design and statistical method, then select Calculate statistics.
Export repeat sources by marker
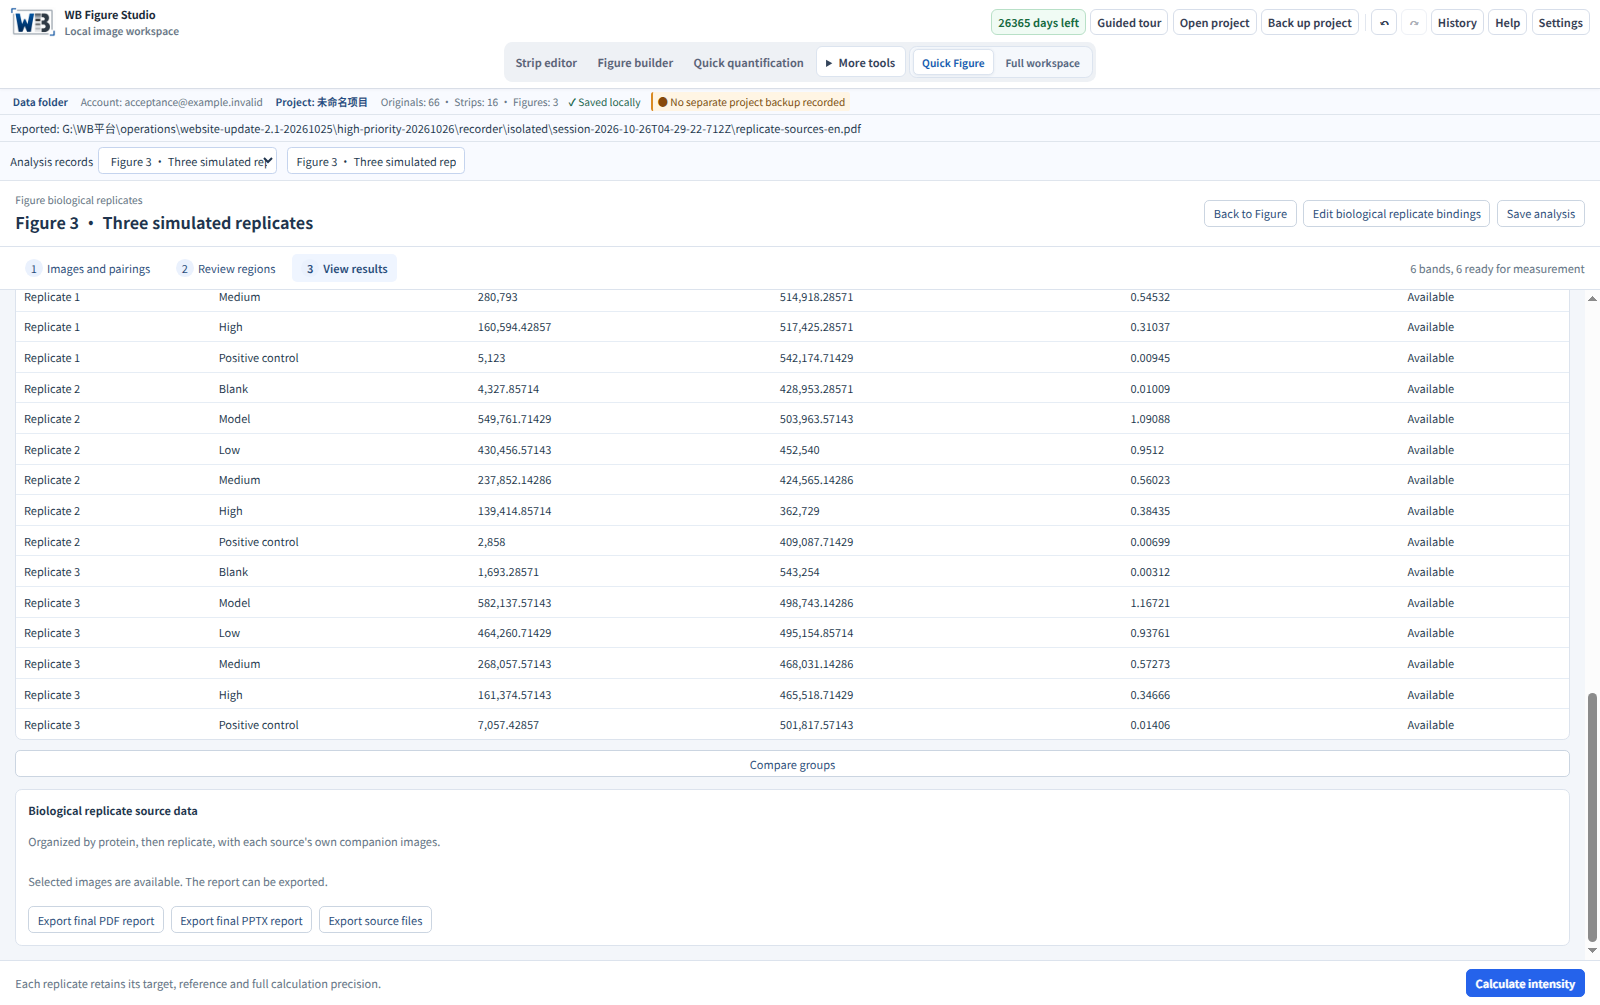
Organize each repeat’s originals, companion images and measurement records together.
Get started with this feature
Link the remaining repeats
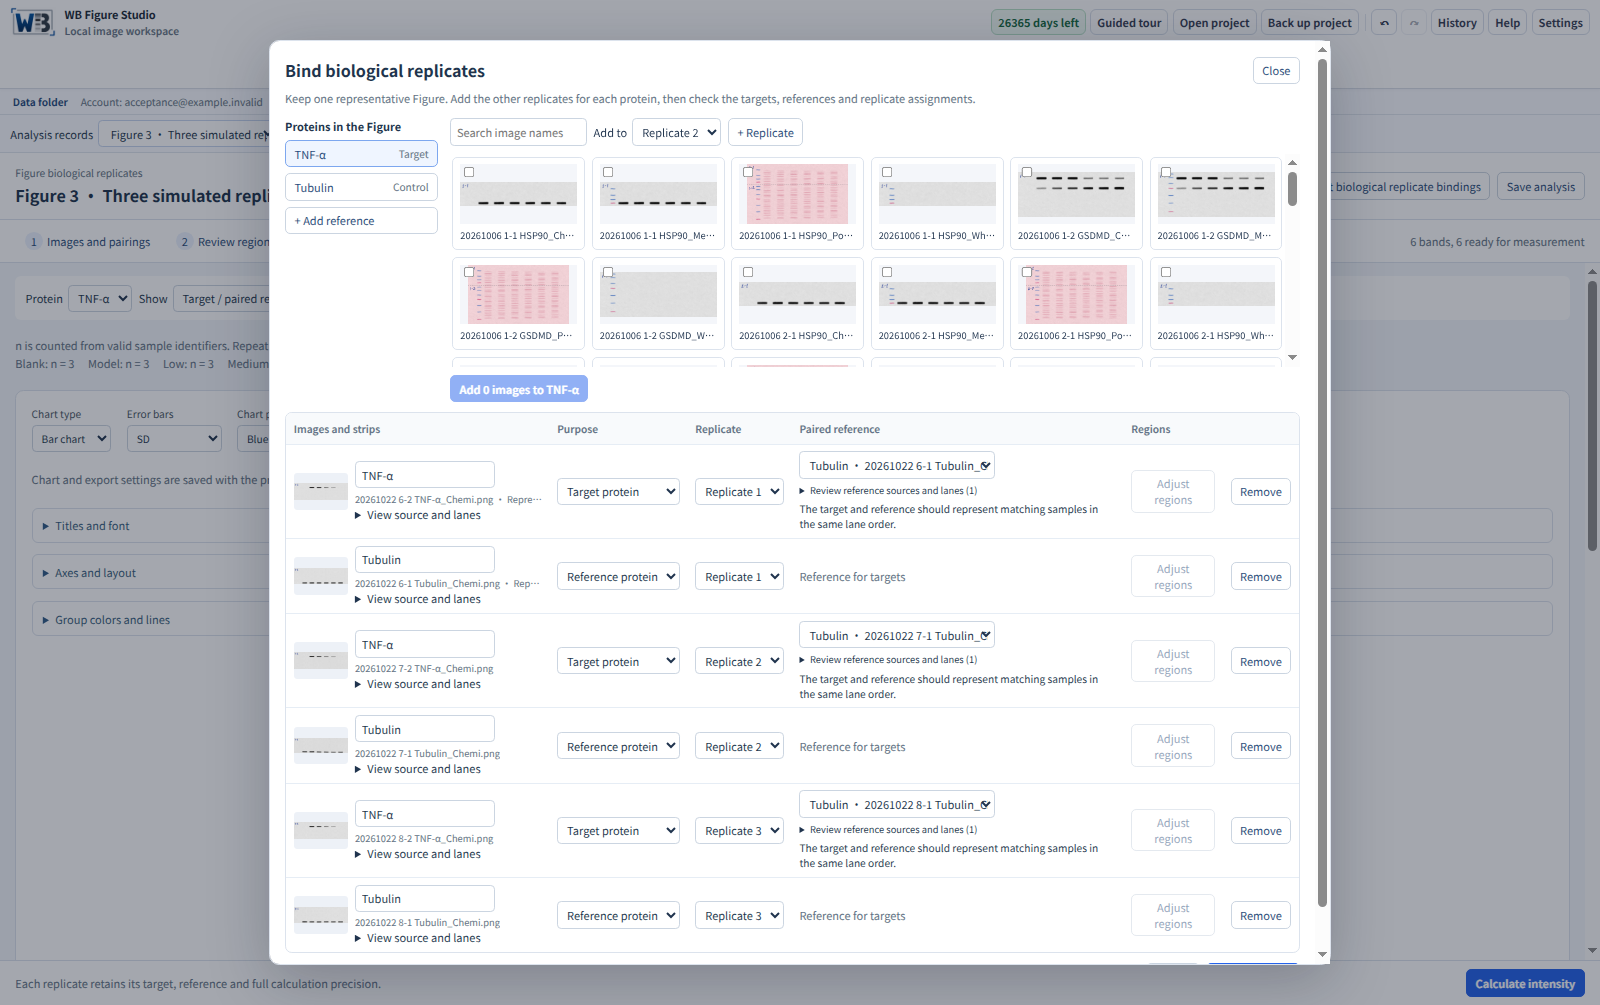
Finish one representative figure. Open Bind biological replicates and select the remaining images for each target and reference strip from the library; multiple images can be selected.
Confirm samples and matching
Review targets, references and lanes within each repeat. Reuse group labels, but confirm sample identity, membrane source and lane order. Markers and empty lanes are not samples.
Quantify, review statistics and export
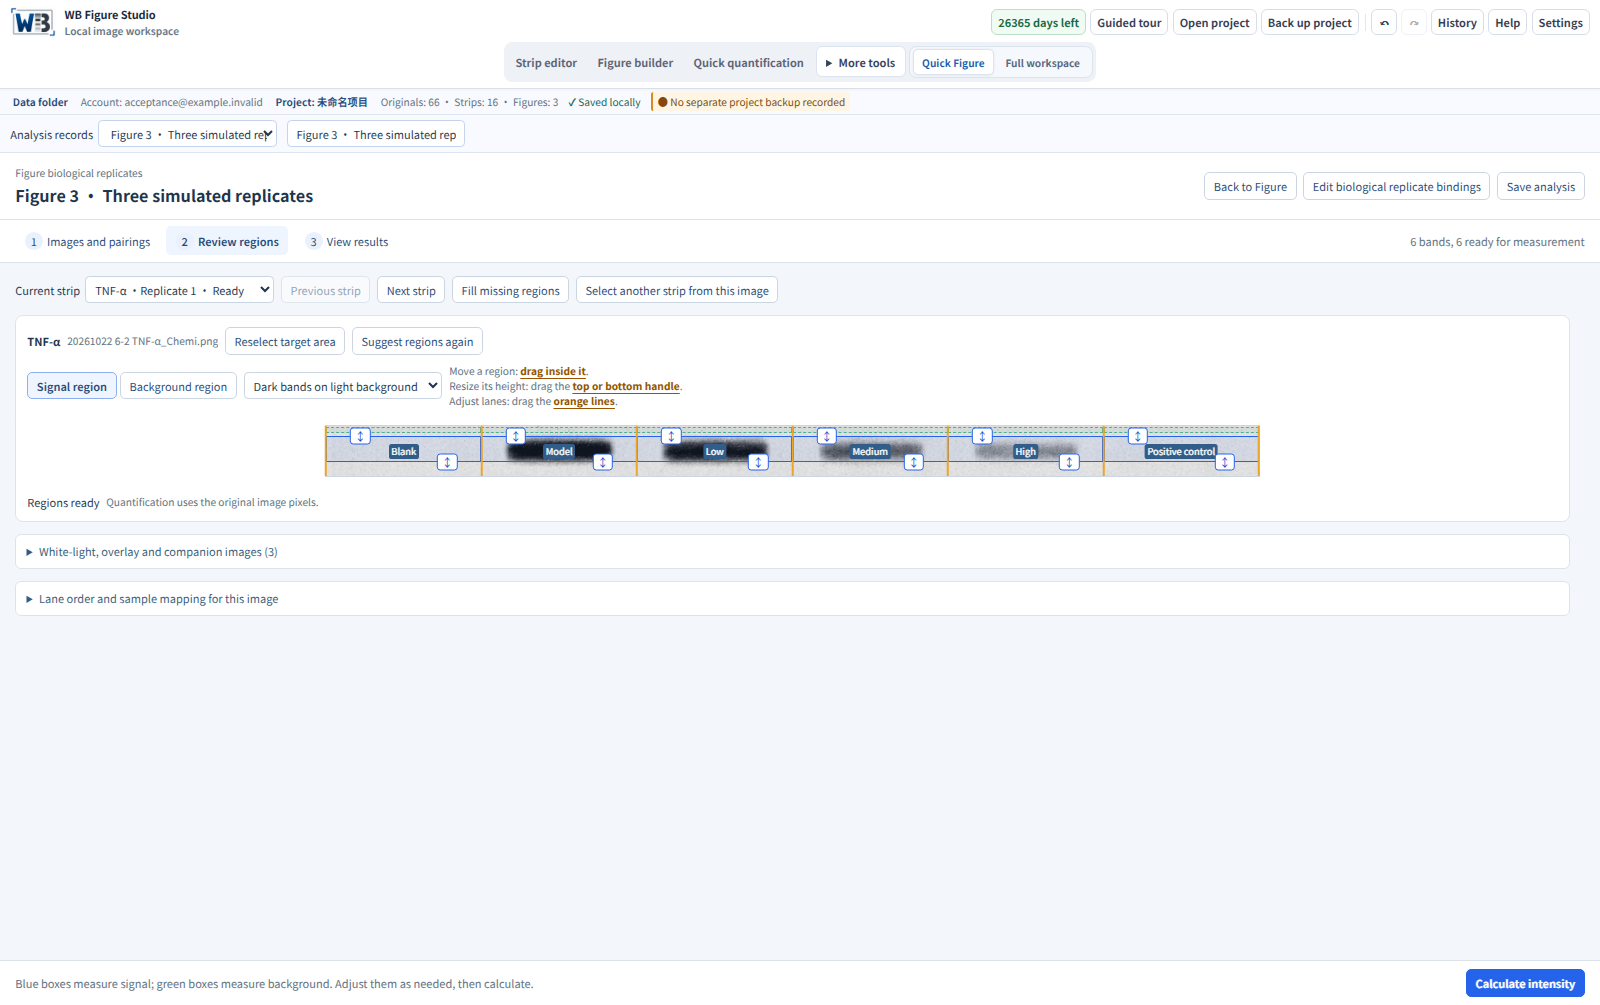
Open Biological replicate quantification, check suggested lanes and backgrounds, and calculate. Review individual points, summaries and applicable statistical suggestions, then export results or each marker’s repeat originals.
Updated illustrated steps
Actual screenshots from Windows build 2.1.3 using simulated examples. Select any image to view it at full size.
Open examples and inspect the exports
Inspect a synthetic three-repeat example
Exported through the actual 2.0.0 candidate interface using native-local-bg-v3. Two targets with their matched references span two groups and three synthetic repeat labels, retaining measurements, ratios and sources. The source package contains algorithmically generated PNGs and a manifest. These demonstrate calculation and source mapping, not a real experiment or biological finding.
Usage and interpretation
Match a reference within each repeat
Check targets, references and lane order against the sample identities within each repeat. Keep markers, empty wells and missing samples as they are; do not fill gaps using other membranes or neighboring lanes.
Three files do not necessarily mean three biological replicates
Repeated exposures, scans or loading of the same sample are technical repeats. Independent sample counts come from the experiment. Unknown or missing relationships remain unresolved instead of being filled automatically.
Combining blots from different dates
First calculate each sample’s target/matched-reference ratio. For expression relative to a control, select an explicit control baseline and retain whether it is a pooled control mean or the control within each experiment. Normalization does not automatically remove between-blot or batch effects.
Display conversion and statistical analysis
Display the target/reference ratio, divide by the pooled control mean, or divide by each run’s own control. Plots retain individual independent samples, means and SD. Statistics use original ratios by default. A run’s own control forced to one is not treated as an independent sample with zero variance.
Source data organized by marker
For example, list repeats 1, 2 and 3 of TNF-α with their companion images, followed by IL-6. Preserve original identities and lane references. A source can be stored once, but separate membranes are not presented as one continuous blot.
Take results to your plotting software
Copy data pastes directly into Excel or Prism. Export Excel retains multiple measurement and source sheets. Formal replicate analysis also offers PDF reports, PPTX reports and a source-file package with a manifest. If information is missing, export a draft with missing-field labels. Complete and review the information before generating a final report.
Before choosing a statistical test
Identify independent or paired designs, technical repeats, n per group and missing values. Show each independent sample and identify the plotted error bars as SD. Suggestions do not replace the experimental design or count repeated exposures as extra samples.