Quick intensity analysis
Drop in a whole-blot image, select the target row and check lanes, then calculate ratios from original pixels. No figure is needed first.
Practice with built-in examples without signing in. Register for free figure tools and an eligible full-feature trial of up to one month, subject to account and device history. After online verification, use your authorized features offline on this computer for 30 days.
From preparation to a clear result
Start with your images
Select the target row on a whole blot without making a figure first.
Review suggested lanes
Check each signal, local background and matching reference before calculating ratios.
Measure original pixels
Display adjustments stay separate from measurement. Save or export results with source records.
Get started with this feature
Import original blot images
Drop in the original chemiluminescence images. Originals are retained and display adjustments are excluded from measurement.
Match targets and references
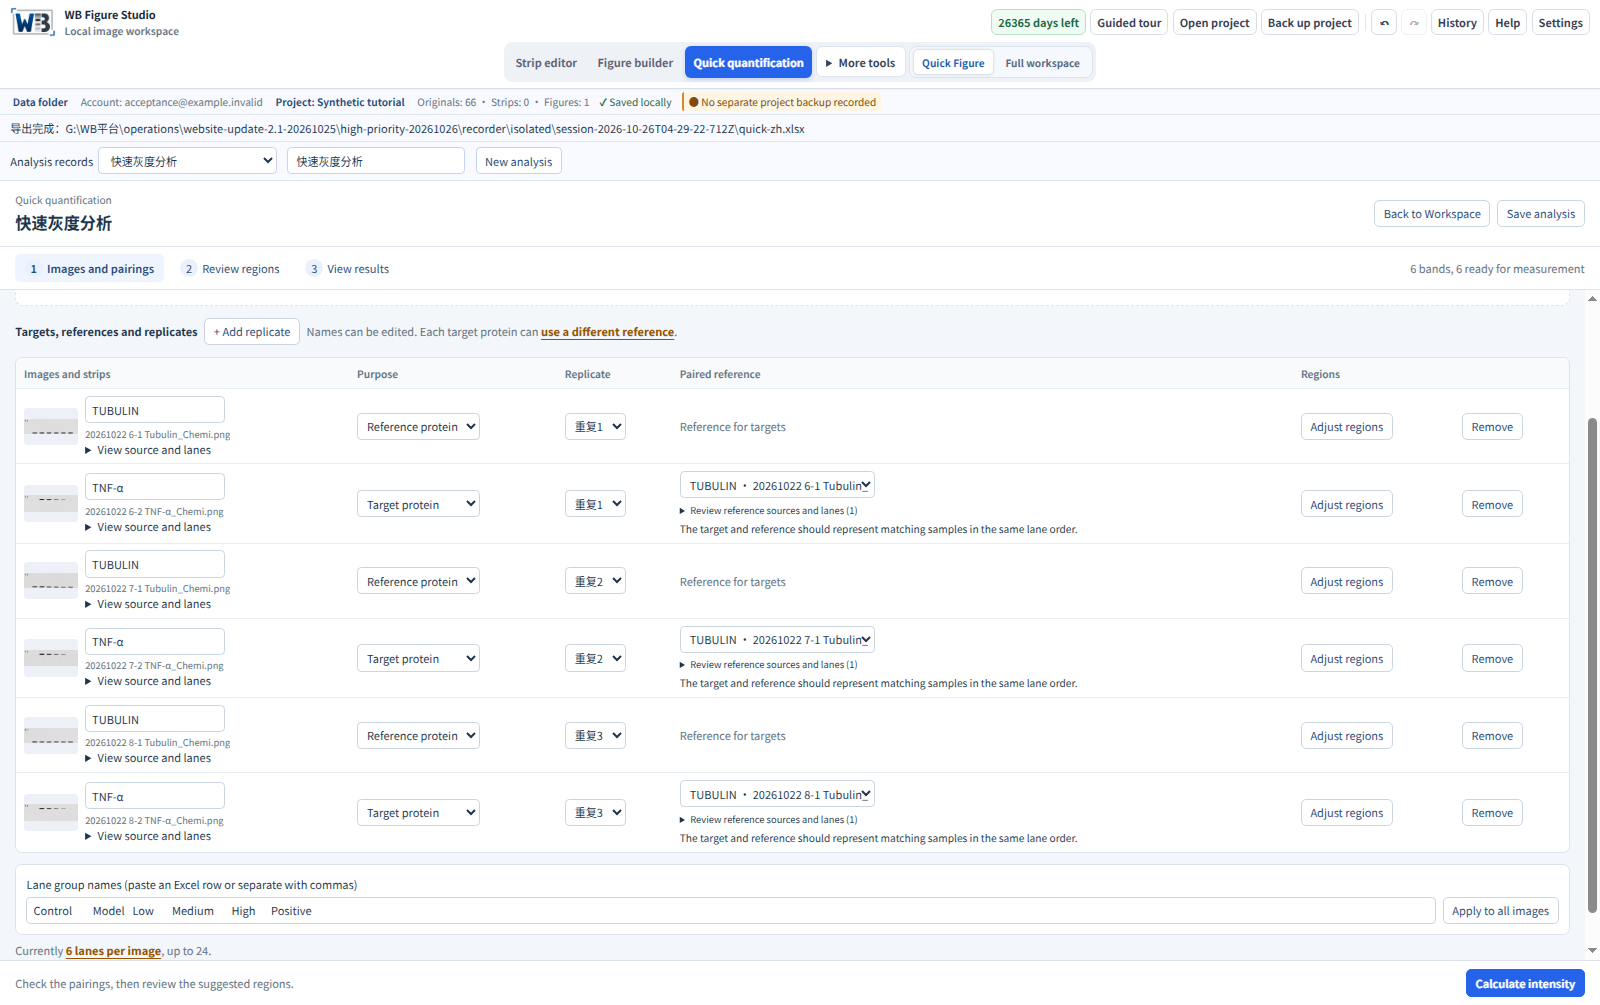
Review suggested protein names and roles. Choose each target’s reference from your experiment, then check samples and lanes. The example uses Figure 2 TNF-α 4-2 → same-membrane Tubulin 4-1. Use your experimental records to establish the actual pairing.
Select, review and calculate
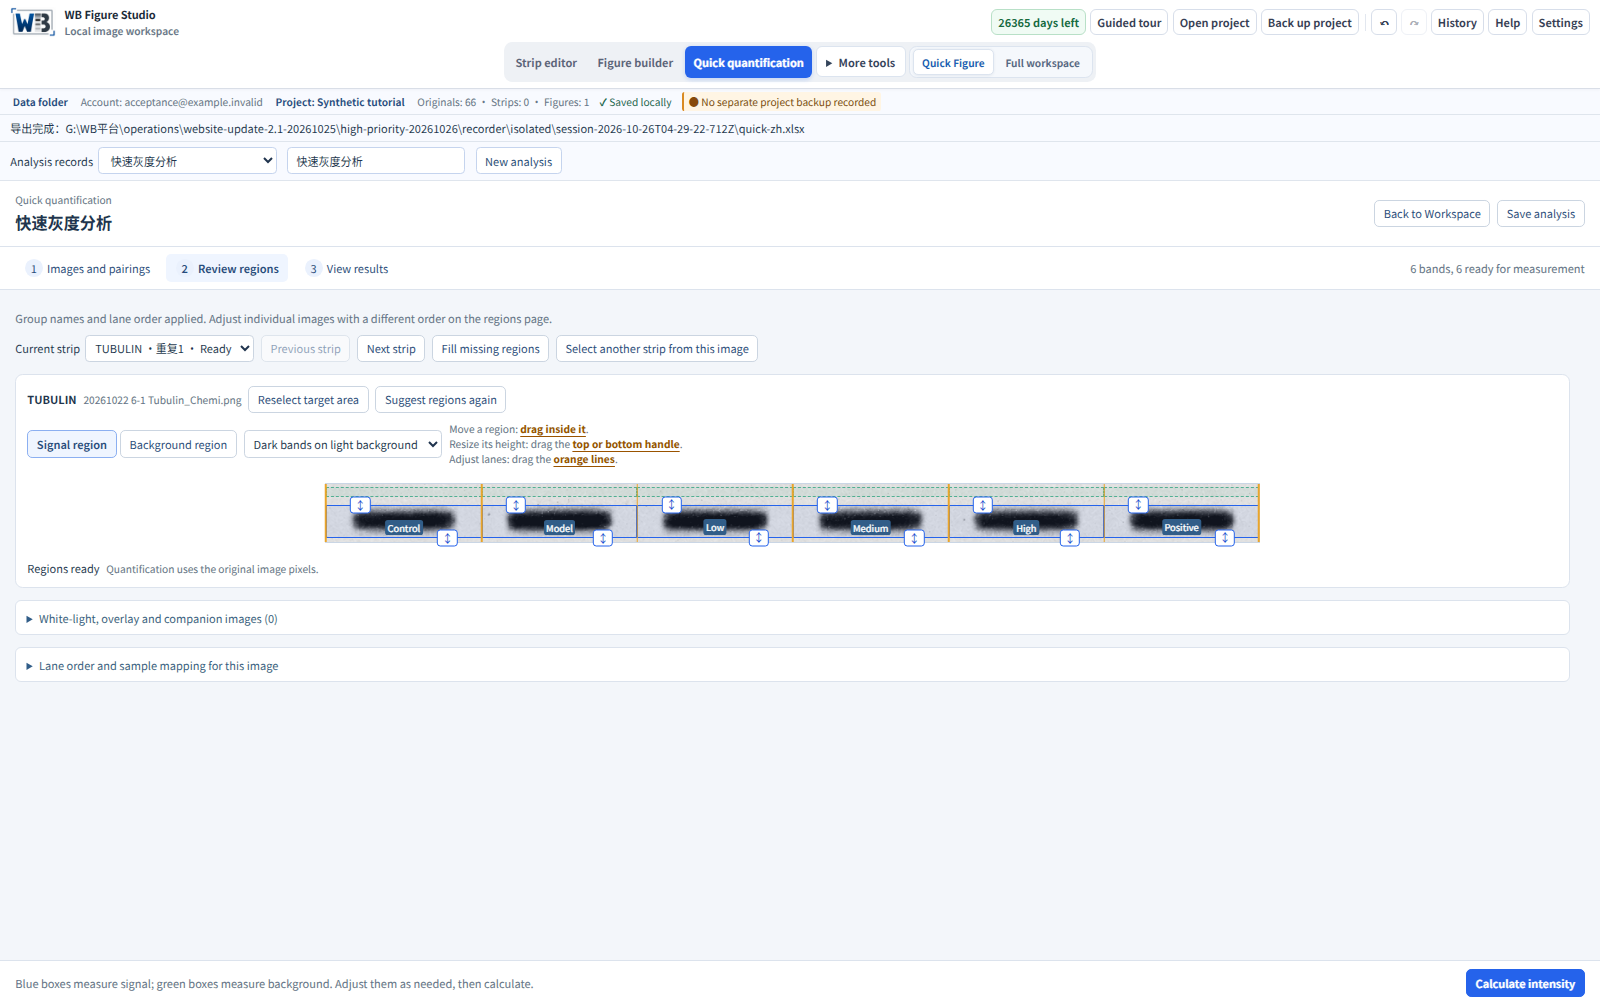
On each whole-blot image, select the target row across all sample lanes, leaving background above and below. Release to suggest lanes, then review signal and background regions before calculating target/matched-reference ratios.
Updated illustrated steps
Actual screenshots from Windows build 2.1.3 using simulated examples. Select any image to view it at full size.
Open examples and inspect the exports
Inspect a synthetic three-repeat example
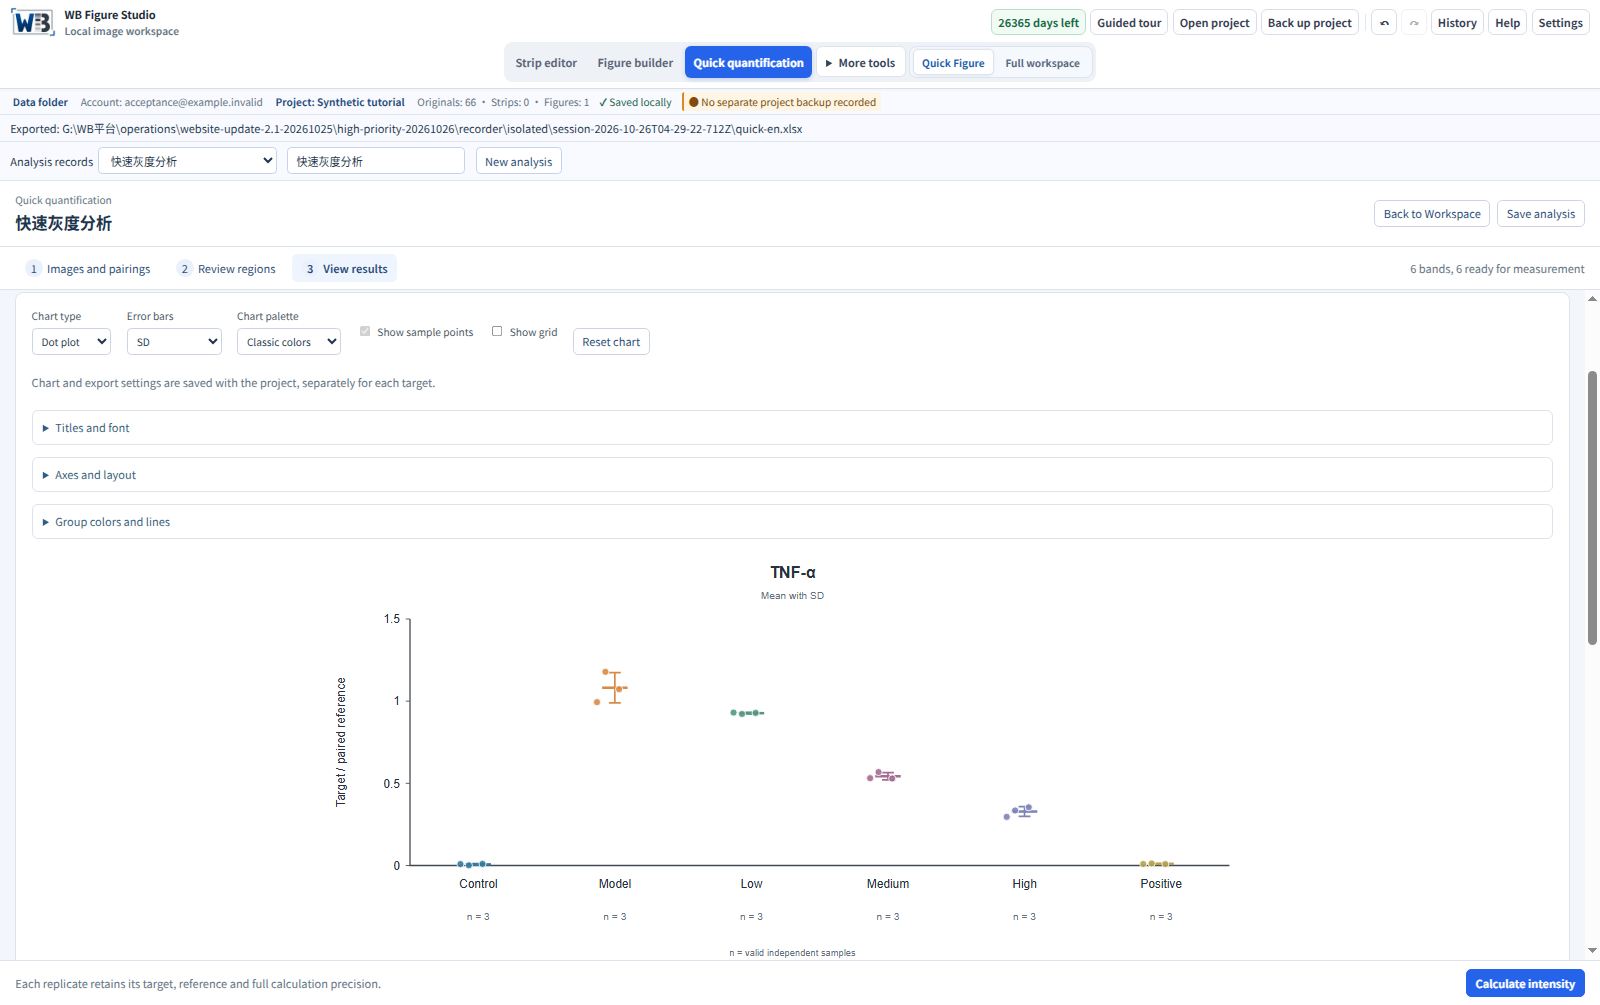
Exported through the actual 2.0.0 candidate interface using native-local-bg-v3. Two targets with their matched references span two groups and three synthetic repeat labels, retaining measurements, ratios and sources. The source package contains algorithmically generated PNGs and a manifest. These demonstrate calculation and source mapping, not a real experiment or biological finding.
Usage and interpretation
Select the target row, then review suggestions
A whole blot may contain several signal rows. The software does not identify biological targets from filenames or choose the target row for you. Adjust suggested lanes, signals and backgrounds, then calculate from original pixels. Display adjustments do not enter measurement. Save the analysis as a project or export Excel.
Names suggest roles; samples determine pairing
Names such as ACTIN, β-actin, TUBULIN and GAPDH1 can help suggest roles. Assign them manually when repeat IDs, membrane sources or lane order are unclear. Similar filenames alone do not justify borrowing a reference from another membrane.
What the result means
Each ratio uses the target and reference belonging to the same sample. Statistical summaries count independent biological samples; technical repeats do not automatically increase n. Images alone cannot establish a linear exposure range.