From blot images to a clear result
Arrange figures, run quick intensity analysis, summarize biological replicates and statistics, organize source data and export antibody tables in one workspace.
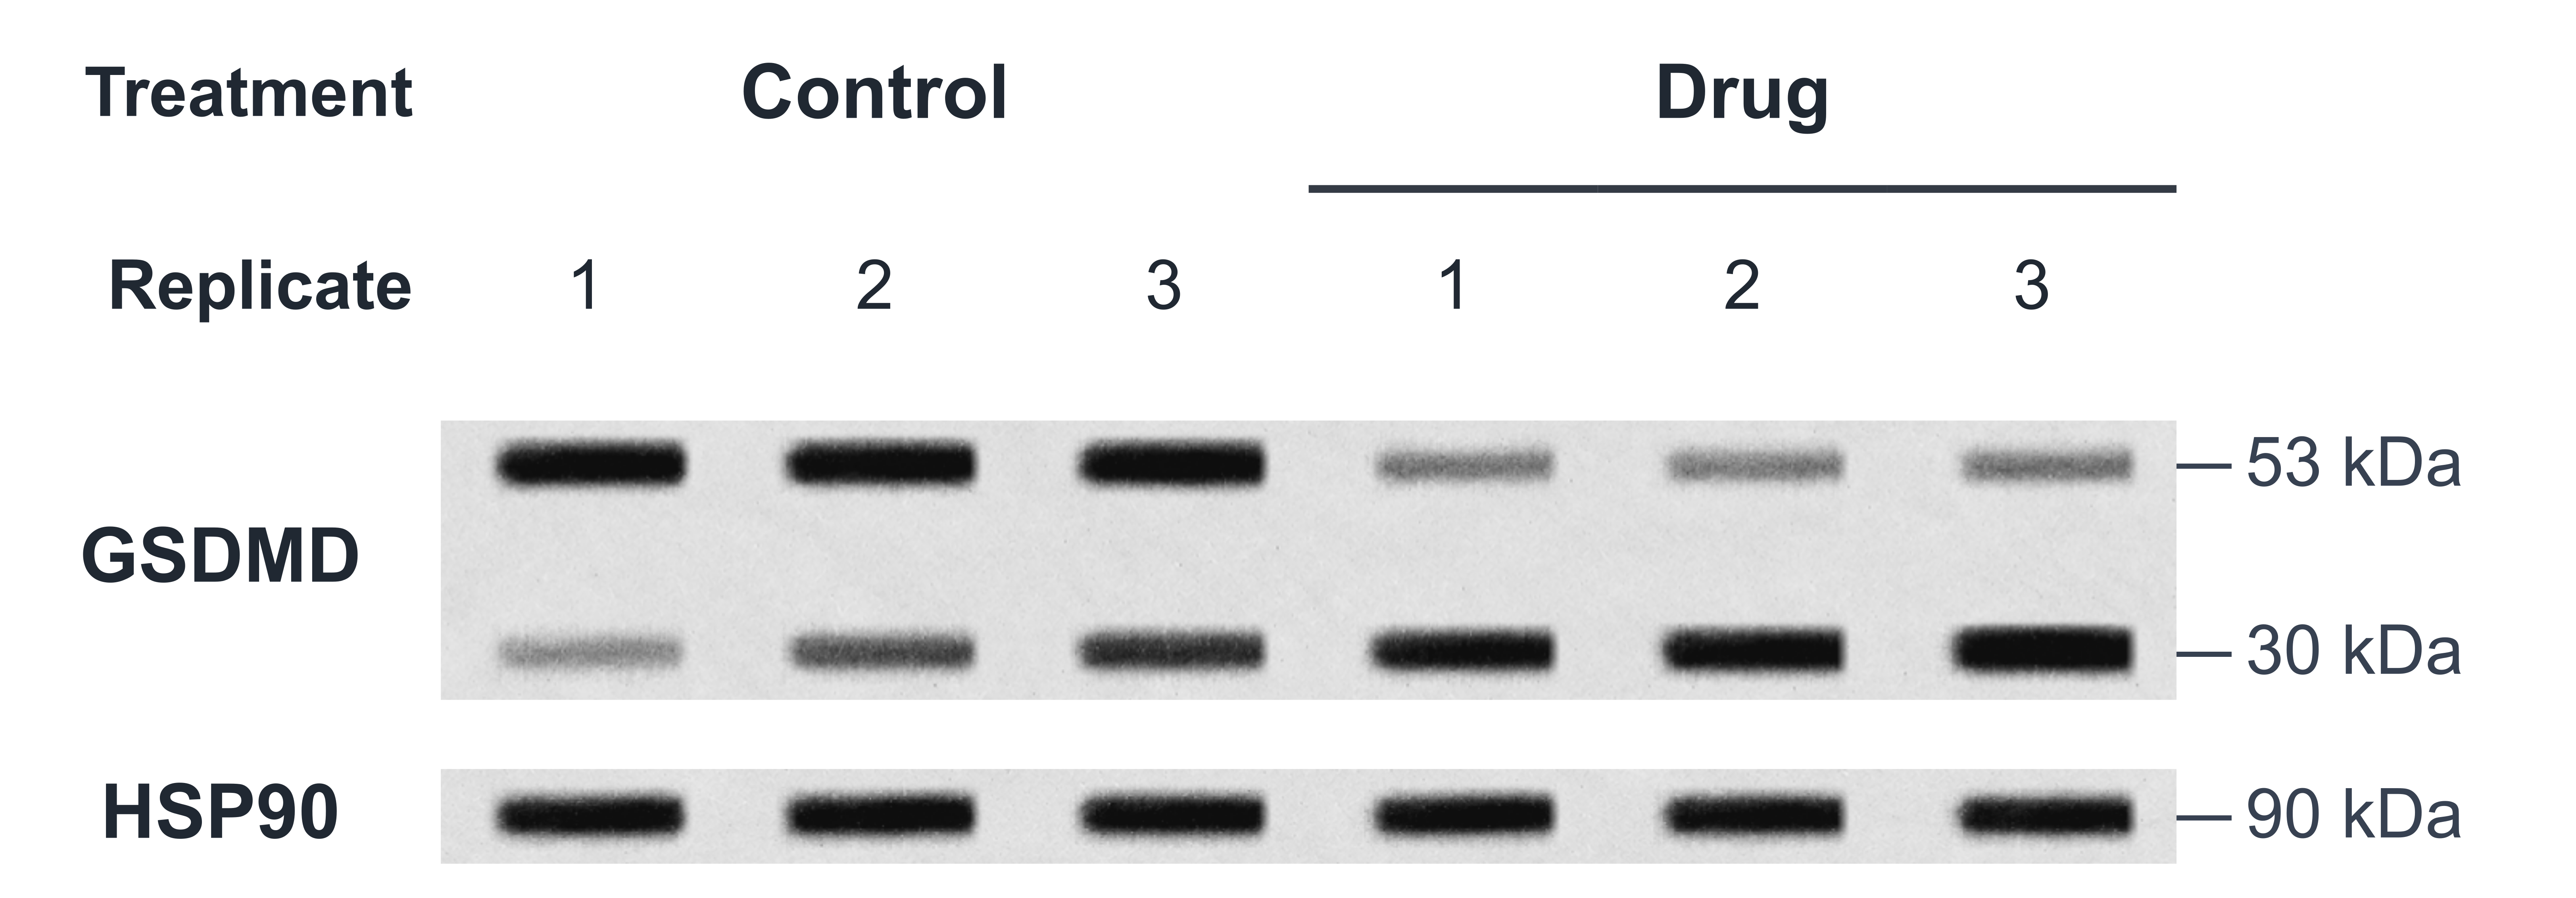
Figure layout
Arrange treatment conditions, protein names and molecular weights. Format the labels and underline lanes sharing a treatment to build a clear figure.
- Add conditions quickly
- One treatment, several lanes
- Style labels for your layout
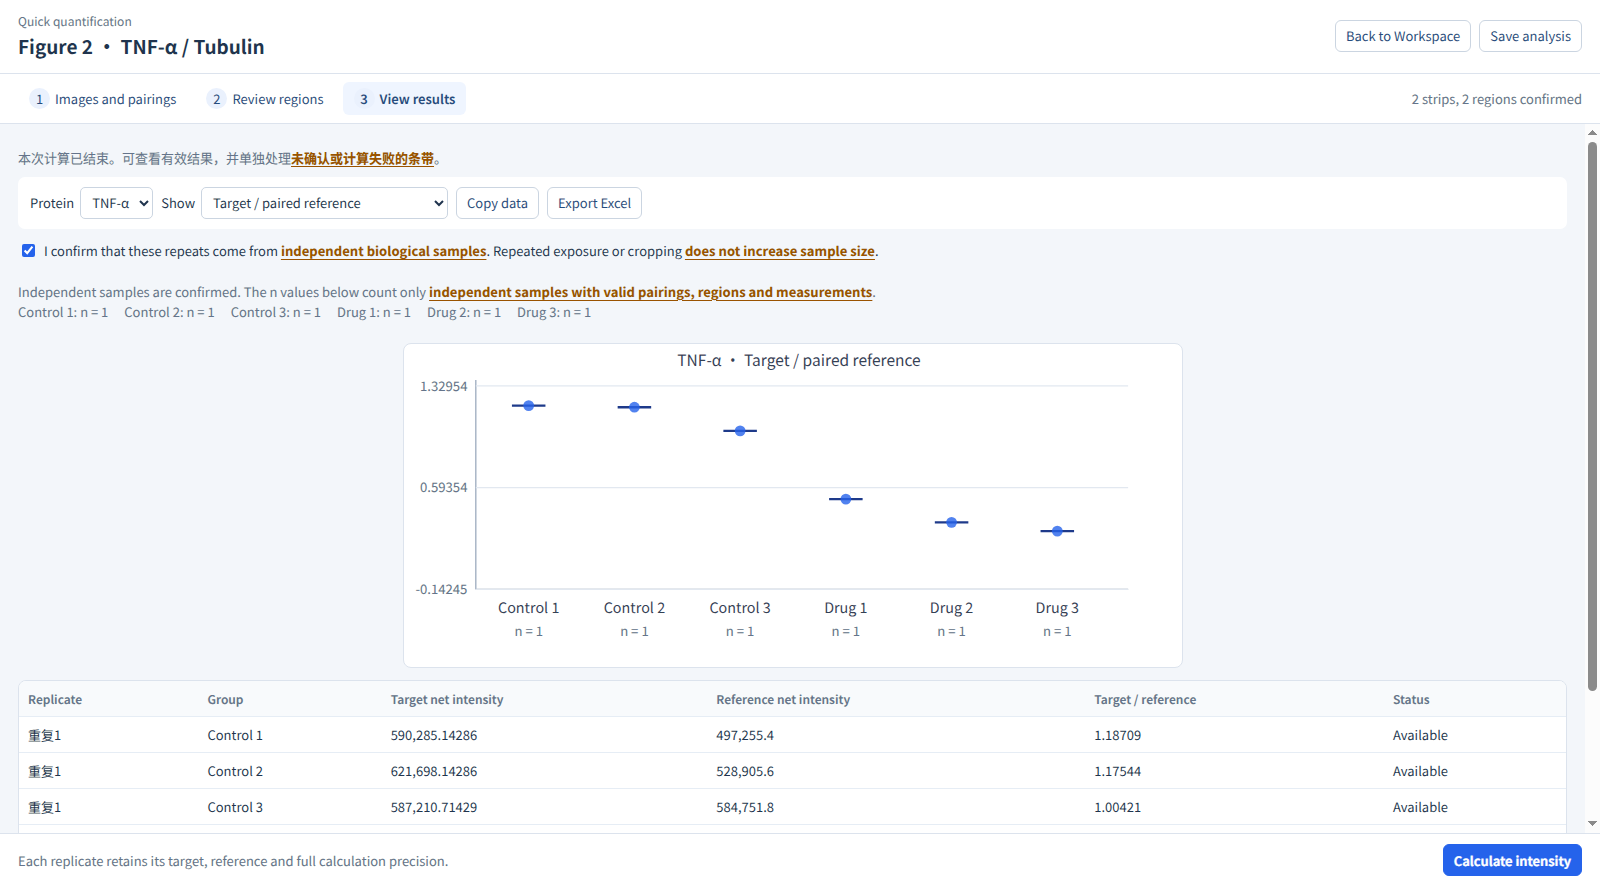
Quick intensity analysis
Drop in a whole-blot image, select the target row and check lanes, then calculate ratios from original pixels. No figure is needed first.
- Start with your images
- Review suggested lanes
- Measure original pixels
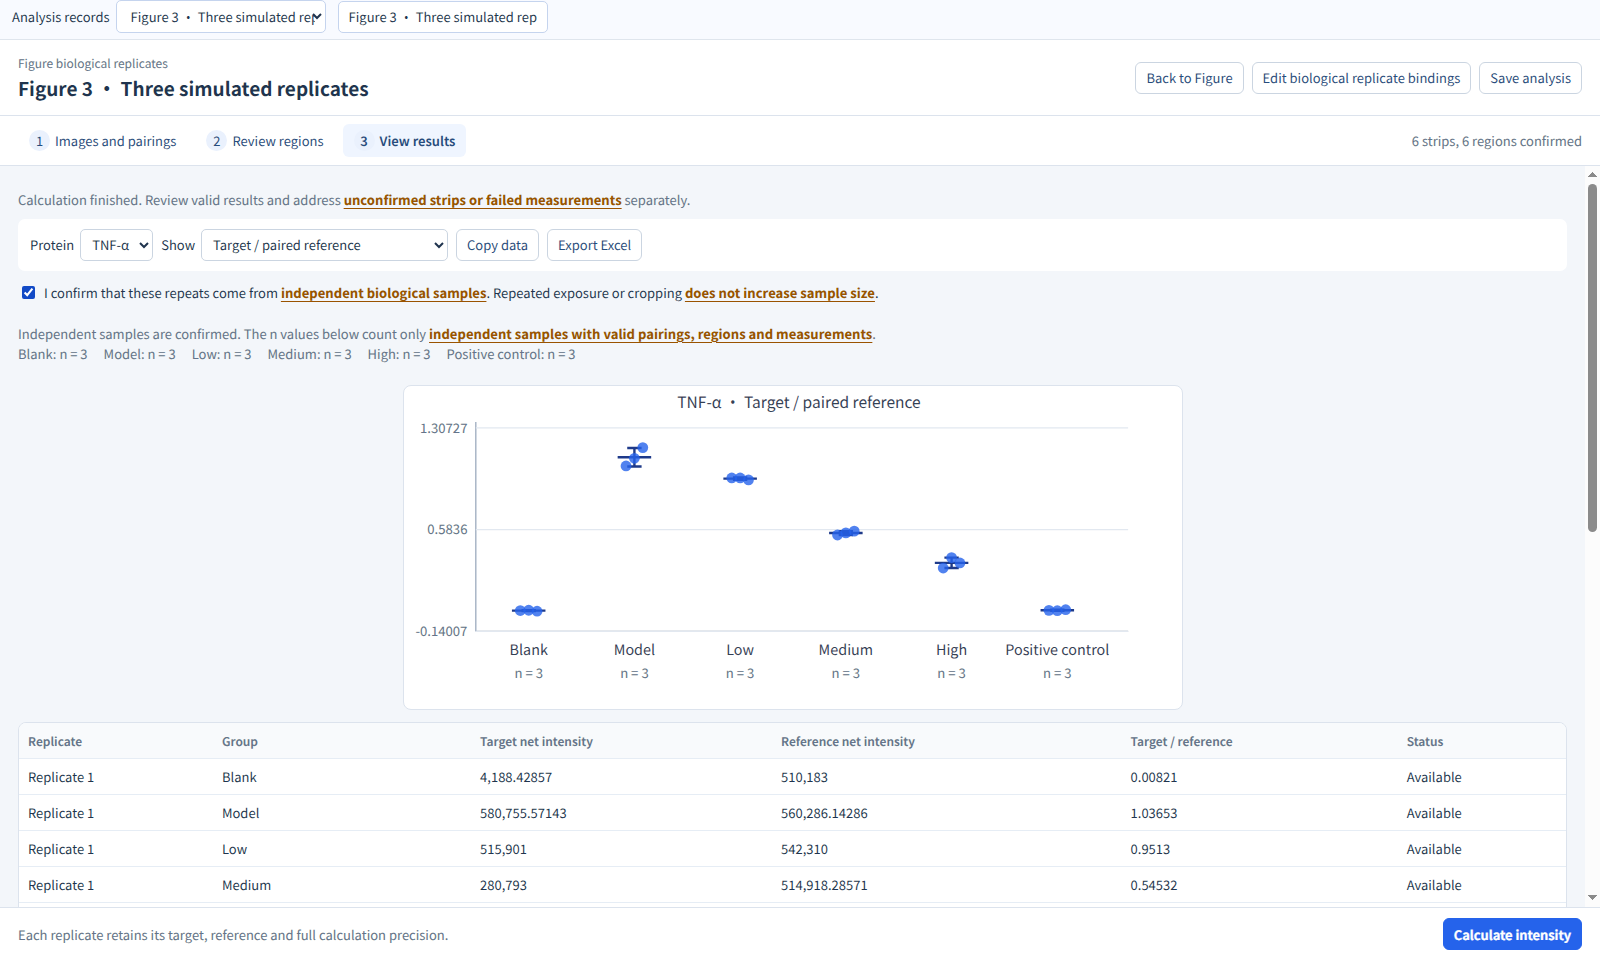
Replicates and statistics
After making a representative figure, link the remaining repeats for quantification, summaries and source-data export.
- Link repeats to one figure
- Inspect samples and statistics
- Export repeat sources by marker
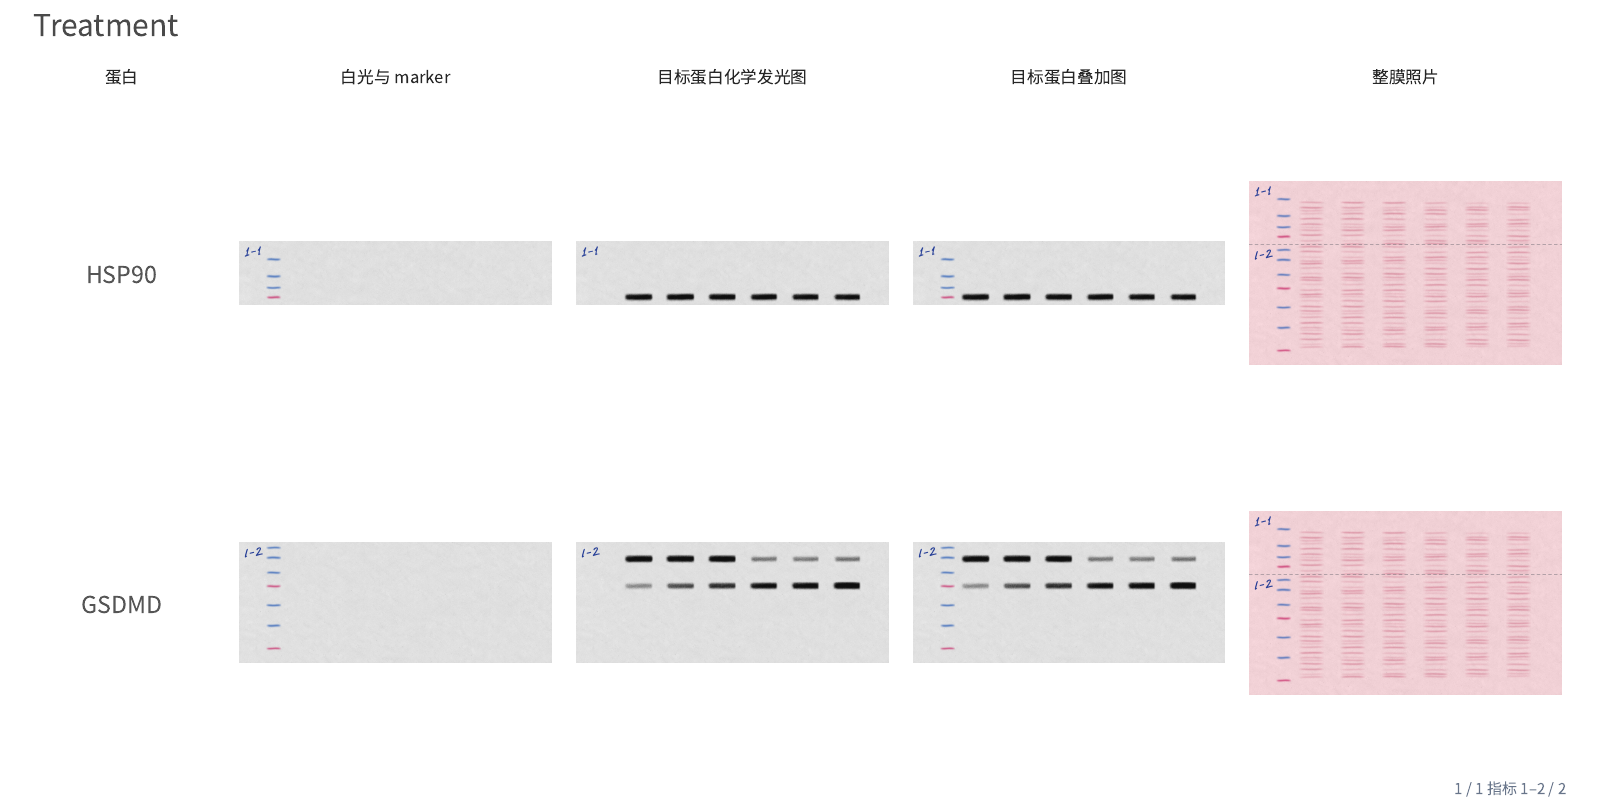
Source-data organization
Trace figure elements to their sources and match companion images by filename. Review the complete originals, arrange columns and headings, then export the source-data document.
- Collect the figure’s originals
- Match companion filenames
- Arrange your columns
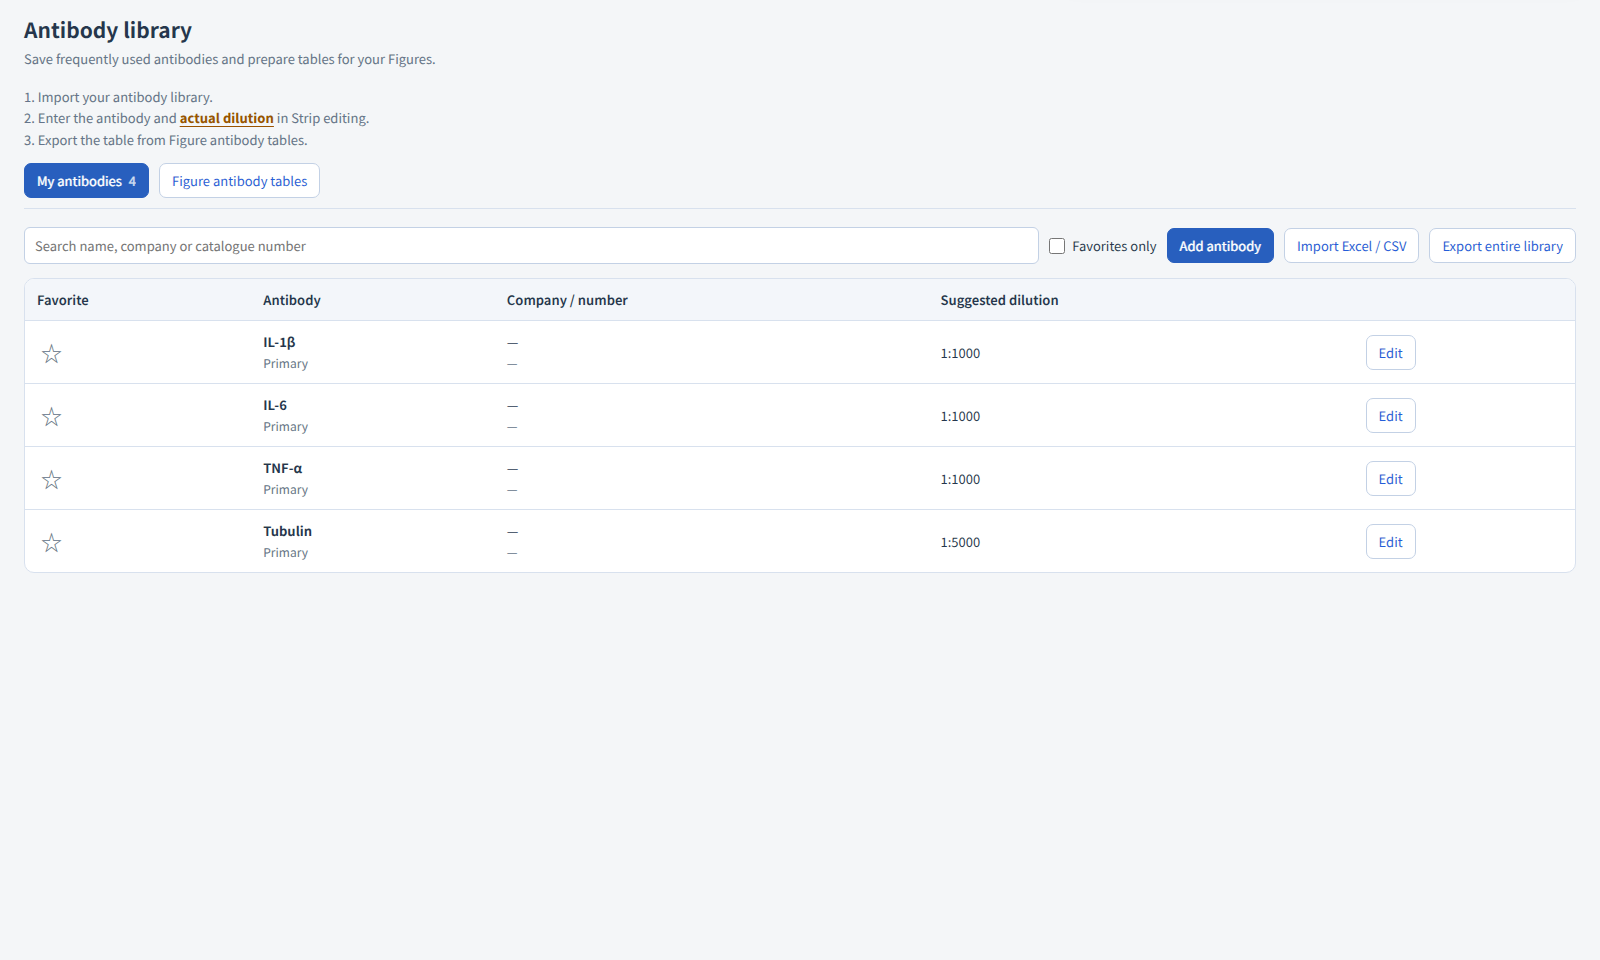
Antibody library and tables
Import your antibody library from Excel or CSV, record actual use on strips, and export the antibody table for selected figures.
- Import Excel or CSV records
- Record actual antibody use
- Export tables for selected figures
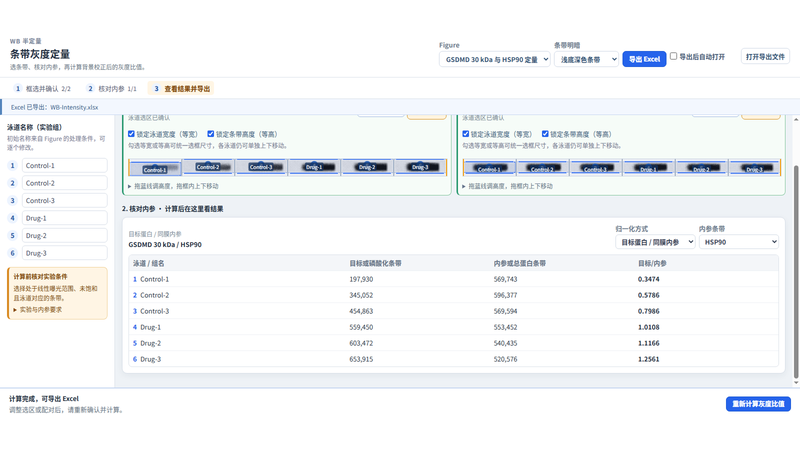
Quantify figure bands
Measure Western blot band intensity from original images, subtract local background, normalize to a matched loading control and export the results to Excel.
- Consistent, adjustable regions
- Background-corrected densitometry
- Two normalization modes
Work locally. Keep your originals.
Crop, arrange figures and quantify bands on your computer. Import copies the complete originals without changing the source files. Bands and figures retain their source links for review.
Saving and backup
Projects are stored locally. After editing, export a .wbfig project package and keep a separate backup that you have checked.
Accounts and licensing
Sign-in uses the account service to check your identity and license. It does not sync experimental images to the cloud. The privacy policy explains account data, orders and website analytics.